
In an Amazon pricing study conducted with Sellzone and Semrush data, we learned an extraordinary amount of information about how Amazon merchants manage pricing over time, how volatility looks on Amazon, and various other aspects of Amazon pricing patterns.
The study may help Amazon shoppers become smarter buyers, but it’s also a combination of insights for merchants who want to improve their pricing practices.
In this article, we cover the 11 key takeaways from the Amazon pricing study, to unveil actions that merchants can take with their own online businesses.
After all, as the dominant leader in ecommerce, Amazon tends to provide hints as to how other ecommerce businesses can improve their operations; Amazon also dictates trends that you may want to jump on board with.
Take a look below for the key takeaways from the Amazon pricing study.
The Key Takeaways from Amazon’s Pricing Study
Here’s what the Amazon pricing study entailed:
- Semrush and Sellzone analyzed 700 of the most popular items on Amazon.
- They separated the products into 10 categories for a better look into category-specific patterns.
- The study returned anywhere from 20 to 70 results for each product. Those search results were conducted from November 2021 to January 2022 using Semrush and Sellzone searches.
- These results helped gain a stronger view of a more real-world pricing landscape, considering they spread it over a longer period of time and completed multiple searches for the products.
- The study analyzed top keywords used for the searches and pricing as those search results came in.
What Can Merchants and Shoppers Learn from the Amazon Pricing Study Results?
After the study, Semrush and Sellzone were able to analyze data to develop answers about pricing strategies and patterns that occur as time passes. Here are the most pressing questions you can answer with the study’s results:
- Are coupons and discounts on Amazon usually category specific? Whether or not, which types of coupons and discounts become the most popular?
- Are there any pricing patterns to look out for during the weekdays?
- Are there any particular times when prices are the highest?
- Are discounted prices typically artificial, or are they actually deals?
- Are there price differences between popular buying seasons and “regular” days?
- Are there times or days in which it’s best to avoid, or pursue, shopping on Amazon? (When are the lowest and highest prices?)
- What are the most volatile products and product categories on Amazon.
- What’s the average price for specific products and categories? And does this average change as time passes?
And now, our key takeaways from the study:
1. The Average Product Price Across all Amazon Categories is $142.74
We know Amazon as a place for lower priced items, but the study shows that average pricing is actually more around the $142 mark.
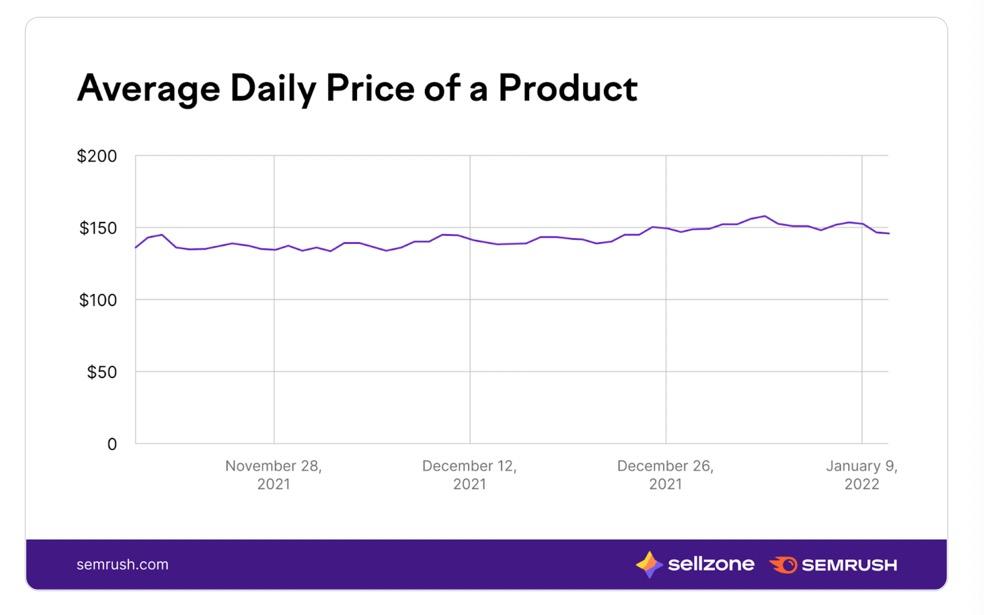
There could be several reasons for this: first, we know that the study looked at 700 of the top products on Amazon; it’s possible those 700 products simply had higher pricing. However, Amazon is a large marketplace, so the $142 average is potentially more about the fact that, even though Amazon has low prices, you can also buy extremely expensive products on there, pushing the average up.
Other than that, Semrush’s study looked at the most expensive products and product categories, which included:
- RTS 3080: $2414
- Gaming PCs: $1586
- RTX 3070: $1543
- PC gaming products: $1,253
- Gaming laptops: $1242
- Samsung TVs: $1144
- PCs: $1060
- Graphics cards: $1006
- Macbook Pros: $979
- 65-Inch TVs: $966
These “most expensive products” may seem somewhat low in price, considering you can purchase items on Amazon for tens of thousands of dollars. But these are the most expensive items from the top 700 products in the study. So, they’re products that are popular, actually sell, and still have high pricing. And, as you can see, most of the higher priced items are either tech or gaming related.
We can also look at the most expensive products (based on average and the entire Amazon catalog):
- A Sony 4K Home Theater averages at around $40,000
- A Fly YUTING Gaming Chair averages at around $39,000
- A JFF Gaming Chair averages at around $38,000
- An Ecobot cleaning robot averages at around $36,000
- A Topesel 256GB Micro SD card averages at $28,000
But these high-priced items aren’t necessarily from the top 700, so there’s no telling if they actually sell for these prices.
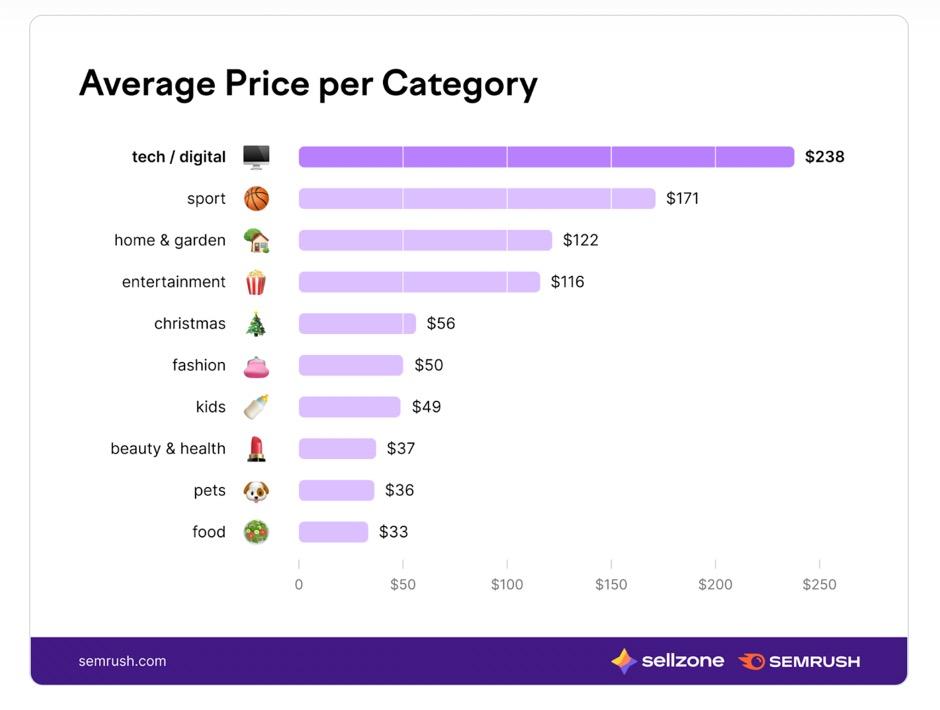
And here are the highest priced categories from the study:
- Tech/digital
- Sport
- Home and garden
- Entertainment
- Christmas
- Fashion
- Kids
- Beauty and health
- Pets
- Food
2. Discounts on Amazon are Often Fake, and Sometimes Trick Consumers to Pay More than the Average Price
One question that shoppers often have is whether they’re actually getting a deal when a company slashes prices. Was the “real” price simply inflated to make it look like the “sale” price is significantly better?
The Amazon study from Semrush and Sellzone took a look at this concern so that shoppers have more transparency and merchants get a feel for what the competition may be doing.
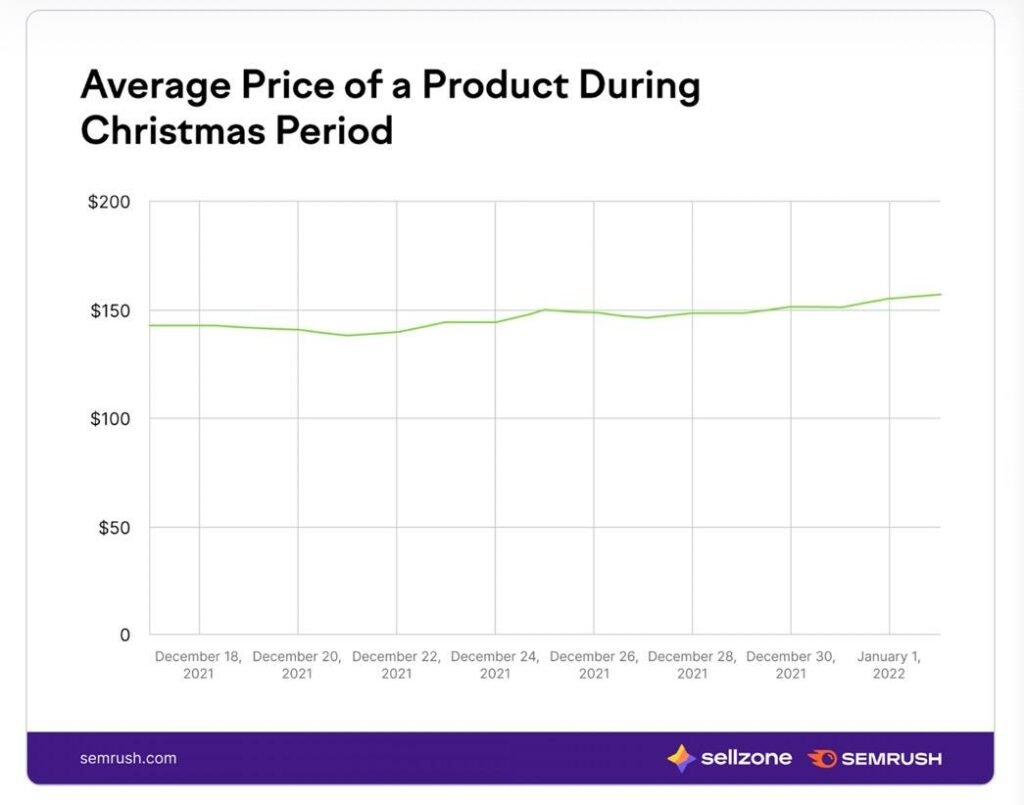
In particular, the study looked at Black Friday and Christmas season pricing, since there are so many discounts. They then compared the holiday discounts to the average prices from the same products throughout the year.
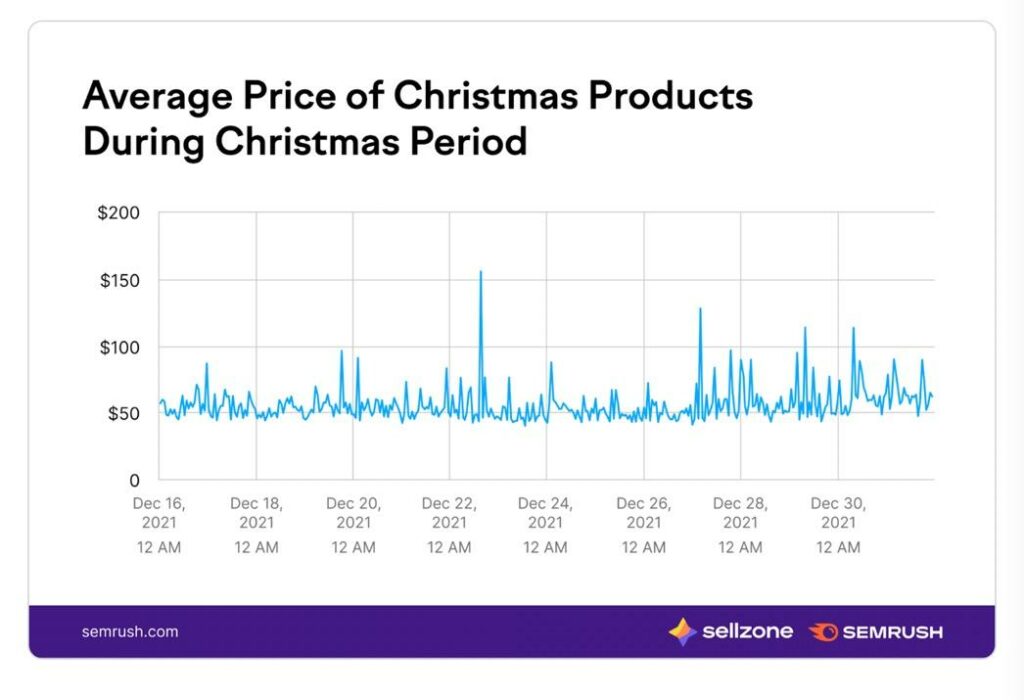
After analyzing the most discounted items on Amazon during Black Friday, here’s what they found:
- Listed “deals” claimed to save customers anywhere from $900 to $3,000. Most of these items ended up being higher priced electronics like TVs.
- Many of the “base” or “original” values weren’t actually real, meaning the merchants inflated those “base” prices to make the discounts look more appealing.
- They discovered this by looking at average pricing over time, and spotting that the “base” pricing listed during a sale is often much higher than what the average consumer pays for an item.
- Some sales only saved customers around $4 to $17 when compared to the average pricing of the products.
- One example, a Samsung 75-inch TV listed at $9,997.99 on Black Friday (claiming a discount of around $3,000 due to its $13,000 base price) actually averaged at around $10,015, so the sale was actually for more like $17 off.
- Every single product in the study had an inflated “base” price used to compare it to the sale price, meaning the sales were never as good as they seemed.
- Some items were even less affordable during Black Friday when compared to average pricing throughout the year: A Samsung 85-inch TV cost consumers $294.84 more on Black Friday when compared to average pricing throughout the year. A SAFAVIEH rug cost about $4 more on Black Friday. Both products claimed $1,000+ discounts.
- Some products still had discounts, but not nearly as steep as what was claimed. A Bowflex Treadmill claimed a $1,183 discount, but in reality, it was more like $215 in savings. A Matterport 3D camera claimed a $1,074 discount, but it was actually a $125 savings.
3. The Most Popular Deal is “Limited Time Deal,” and the Most Popular Label is “Prime”
For online store owners and Amazon sellers, it pays to understand which labels and deals have the most effect to make sales.
This analysis doesn’t necessarily tell us that these labels and deals are more successful, but we’re able to see the most popular options, which could show you that there’s something behind the popularity.
As for the most popular deals shown on Amazon (based on the sample size of products analyzed) include:
- Limited Time Deal: with more than 3% of the products having that deal
- Cyber Monday Deal: with about 0.37% of the products having that deal
- Black Friday Deal: with about 0.23% of products having that deal
- Save 20%: with about 0.15% of items having that deal
- Save 25%: with 0.13% of items having that deal
The deals get less and less popular, and most of them are simply a variant of the percentage being saved. For instance, Save 6%, Save 13%, and Save 17% were all on the list, but weren’t used as often as the top 5 listed above.
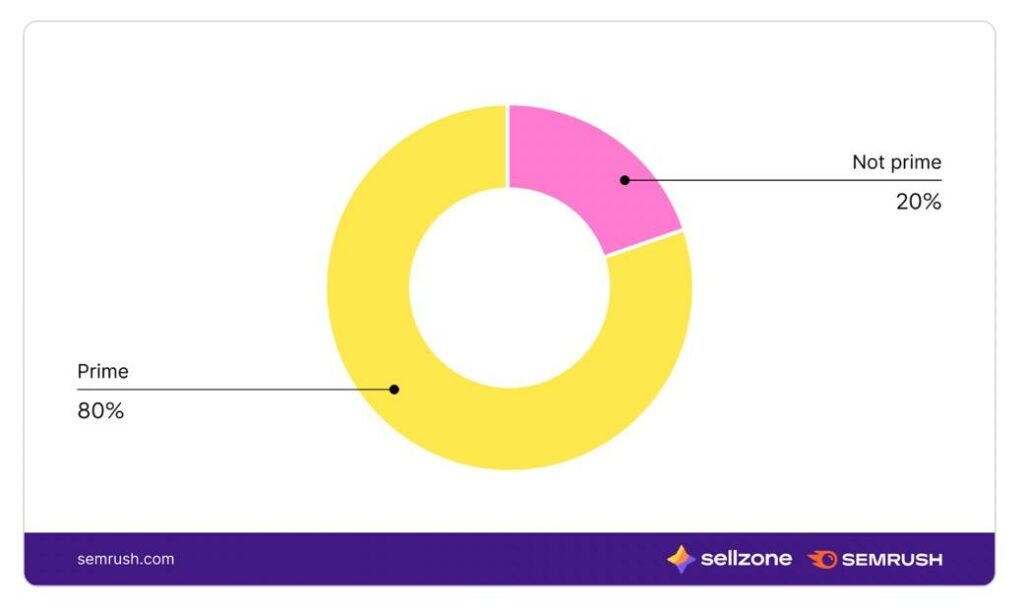
As for labels, “Prime” dominates in popularity, probably because it’s pushed so hard by Amazon, and because customers recognize this as providing extra benefits like free and fast shipping.
Here are the top 5 labels used from the study:
- Prime: Over 78% of the products in the study
- Best Seller: 4.05%
- Save 5%: 3.78%
- Limited Time Deal: 3.51%
- Lowest Price in 30 Days: 2.50%
Other labels in the list, that didn’t make the top 5, include: Amazon’s Choice, Holiday Toy List, Save 15%, Holiday Gift Guide, and Save $5.
The Prime label still dominates on 78.44% of products during the top sales seasons, but others rise to the top 5 spots as well:
- Prime: 78.44%
- Black Friday Deal: 7.93%
- Best Seller: 3.61%
- Save 5%: 3.17%
- Lowest Price in 30 Days: 2.85%
4. It’s Often Wise, Especially for New Sellers, to Consider Selling High Priced Products
When looking at products with the most demand on Amazon, the study revealed an average price of about $142.
This shows that $100+ items aren’t too expensive to sell on Amazon; people are willing to buy them, especially during the hot times of the year—like around the holidays, when consumers are willing to shell out more money for gifts.
This is particularly true since online consumers are used to paying more for electronics and digital items. There’s even evidence that shows newer sellers don’t have as much trouble with higher priced items when compared to lower priced items, since customers are willing to pay that much, and they’re generally looking for a decent deal and a quality product.
5. Merchants Should Be Extremely Careful About Seasonal Discounts
As shown earlier in our recap of the Amazon pricing study, top merchants don’t actually discount their products much during seasonal surges.
Therefore, online store owners shouldn’t jump right into steep discounts just because everyone is doing it. Not as many sellers are doing it as you may think, or the discounts are manufactured to seem more appealing.
So, we simply recommend that you remain smart about discounting during those times, since you want to avoid cutting into your profits that much. And customers are willing to pay higher prices during these seasons, so it’s often better to lean on value-added promotions or smaller discounts.
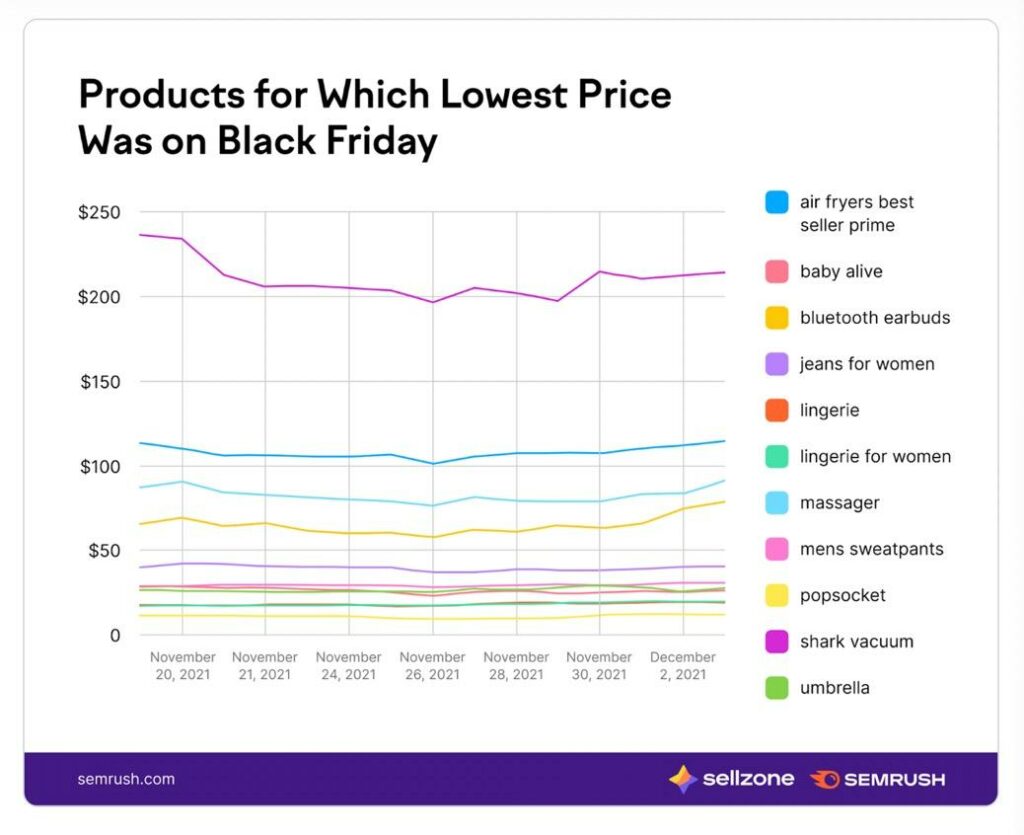
6. Most Products Don’t Have Their Lowest Pricing on Black Friday
This is interesting news for both consumers and merchants. It’s another reason merchants shouldn’t jump right into steep discounts on November 26th, and a reason for shoppers to remember that Black Friday doesn’t seem to make for the best time to buy.
In fact, only 1.6% of the products from this study had their lowest price of the year on Black Friday.
7. Pop Sockets and Women’s Lingerie Have the Biggest Price Drops on Black Friday
The amount of discount shown in the study during Black Friday weighed heavily on the product category.
Pop sockets, women’s lingerie, and bluetooth earbuds saw the most discounted items across their product categories on Black Friday.
Here’s the entire list of the most discounted product categories on Black Friday:
- Popsockets: 23% average discount on Black Friday
- Women’s lingerie: 19% average discount
- Bluetooth earbuds: 19% average discount
- Baby alive products: 18% average discount
- Lingerie: 15% average discount
- Massagers: 15% average discount
- Jeans for women: 14% average discount
- Shark vacuums: 14% average discount
- Mens sweatpants: 9% average discount
- Air fryers: 8% average discount
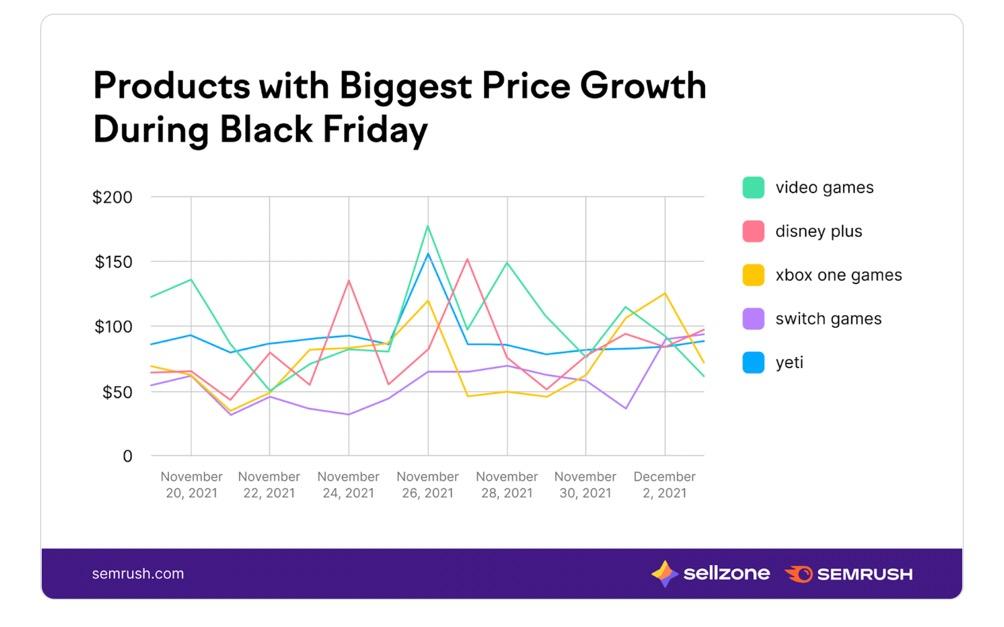
8. Many Products are More Expensive During the Holidays, Including Switch Games and Bathroom Decor
For merchants, this is an opportunity to potentially take advantage of products that see higher margins during the holidays. Yet, for consumers, it would make sense to stray away from these products and categories until the entire Christmas season has passed.
Throughout the Christmas season, these products have the most overall price growth:
- Switch games: with an overall price growth of 214%
- Bathroom decor: 102% price growth
- Disposable masks: 95% growth
- Walkie talkies: 68% growth
- Micro SD cards: 61% growth
- Books for 3-year-olds: 55% price growth
- Cocomelon: 52% price growth
- Kitchen gadgets: 52% price growth
- Telescopes: 52% price growth
- Binoculars: 51% price growth
9. There Are Some Products (Like Alexa and PS4 Games) That Usually Decrease In Price During the Holidays
Quite a few products still actually see price decreases throughout the holiday season, many of which seem to be for very specific brands or Amazon products.
However, there are some opportunities for resellers or more generic products.
Consumers can scout out these products and still know that they’re not being tricked with manufacturer discounts.
The top products that experience overall drops in price during the Christmas season include:
- Alexa: 46% drop
- PS4 games: 44% drop
- Playstation 4: 42% drop
- Playstation 5 console: 39% drop
- Apple Watch series 3: 32% drop
- Christmas decorations on clearance: 29% drop
- Masks: 27% drop
- HDMI cables: 27% drop
- Christmas decorations: 25% drop
- Christmas stockings: 20% drop
So, discounts generally come in the form of name brand products or Christmas items that will have little to no value any other time of the year.
10. Prices Go Up in the Evening
Merchants should take note that shoppers have a tendency to buy more during the evening. As such, the Sellzone/Semrush study showed it’s extremely common for merchants/Amazon to raise prices during the later hours of the day.
They found that 5pm-2am sees the highest pricing across most product categories on Amazon. So, customers should try their best to shop in the mornings, or at least the early afternoon.
On the other hand, merchants have an opportunity to boost their margins by setting their prices a little higher, or at least promoting products for sale in the evening hours.
11. Prices Tend to Go Up After the New Year
From the study, we learned that average prices are sometimes lower during parts of the year besides the holiday season. However, the time immediately after the New Year sees some of the highest prices overall.
The winter holidays make for surges in sales, since so many consumers are looking for great deals. So, it makes sense that pricing tends to rocket back up after that. The merchants are done with their promotions and trying to potentially recoup some of the revenue lost from the immediate drop-off in sales.
Therefore, this means that merchants should be aware of this time period, seeing as how it could prove profitable, if you’re able to reach customers with decent value-added promotions.
As for customers, you’re generally advised to avoid shopping right after the New Year. Instead, only focus on the items that actually have discounts during the holidays (which is, surprisingly, not that many,) or go the wise route and simply shop throughout the year as you normally would, seeing as how average prices tend to be cheaper outside of Black Friday and the holidays.
Some Other Interesting Highlights from the Study
It’s clear that Black Friday isn’t all it’s made out to be for consumers, but there’s definitely a rush of customers, so we encourage merchants to take advantage of this by being cautious with discounts. After all, people are willing to spend more money during the holidays, and there don’t seem to be that many successful merchants running steep discounts during the holidays.
Other than that, we learned that discounts aren’t always “real,” on Amazon, and that prices go up in the evening and after the New Year.
Here are some other tidbits from the Amazon study to help you with your shopping or running an online store:
- The most discounted products on Black Friday generally have higher-than-average pricing throughout the rest of the Christmas season.
- The study consistently showed that Black Friday and Christmas don’t have that great of price drops, but that could have been exacerbated due to supply chain issues at the time of the study.
- The days with the highest prices on Amazon include January 4, January 10, and January 6. In fact, the entire top 10 is in January.
- The highest priced hour is 11PM, followed by 10PM.
- Morning sales tend to have lower pricing.
- 4AM and 6AM are the cheapest times for customers to buy on Amazon. That’s followed by 5AM, 11AM, 8AM, and 12PM.
- The most volatile product pricing comes from Switch Games, Gaming Chairs, Playstation, Rings, Vinyl Records, Xbox products, Disposable masks, LED bedrooms lights, and Roku.
- The average Amazon item on Black Friday costs $137.46, so that’s a little bit lower than the yearlong average price of $142.74 on Amazon.
- For products with significant Black Friday sales, the pricing doesn’t immediately go up after Black Friday. But after the New Year is a different story.
- The worst items to buy on Black Friday include video games, HDMI cables, Apple Watch bands, Apple products, Echos, Yetis, indoor Christmas decorations, tires, and Oculus Quests.
Please let us know in the comments section if you have any questions about these takeaways from the Amazon study.


Comments 0 Responses